A developer posts in the team chat: "The API latency is high. P90 is almost 190ms, and P99 is 370ms. But Grafana shows the CPU at only 30%, far below the limit." You open the dashboard. The service's CPU limit is 2, and it uses only 0.64 CPU on average. The CPU is clearly idle. So what is going on?
This state was reproduced in a local kind cluster. The steps and full output are in the lab article. The absolute latency depends on the lab environment, so this article only looks at the order of magnitude and relative differences.
To answer the question, we first need to know how Linux enforces a CPU limit.
1. From the Pod spec to a cgroup: how does a CPU limit work?
When you write limits.cpu: 2 in a Pod spec, it is easy to read it as "this container can use at most two CPUs." But what actually enforces the limit on the Node is a Linux cgroup: the kernel uses it to put a group of processes together, then limits and counts their resources as one unit. Each container has its own cgroup directory, and the CPU limit ends up as the content of one file in it.
kubelet first converts the limit into two numbers: the period, which is how often the accounting starts over (100ms by default), and the quota, which is the most CPU time that can be used in each period. 2 CPUs means at most 200ms every 100ms. How kubelet converts it kubelet passes these two numbers through CRI to the container runtime, and the runtime writes them into the container's cgroup. CRI resource fields
You can read the result inside the container (cgroup v2, in microseconds):
$ kubectl exec <pod> -- cat /sys/fs/cgroup/cpu.max
200000 100000
So the exact meaning of limit 2 is: at most 200ms of CPU time every 100ms, shared by all threads in this container. It is not a smooth speed cap. It is a budget that is handed out again every 100ms.
2. Why can a service be paused when it averages only 30%?
The Linux scheduler enforces this budget with CFS bandwidth control. Every millisecond a thread runs on a CPU is taken from the quota. When the quota runs out, all threads in the cgroup are paused until the next period starts and the quota is refilled. This pause is called throttling. CFS bandwidth control
"Shared by all threads" is the key. Suppose a job needs 8 threads to each compute 20ms at the same time, 160ms of CPU time in total:
- With limit 2, each period has 200ms, which is enough in one go. The 8 threads run in parallel and finish in about 20ms.
- With limit 1, each period has only 100ms. With 8 threads running together, the budget is used up in 12.5ms, and then all of them stop. They wait for the next period, then use 7.5ms to finish the rest.
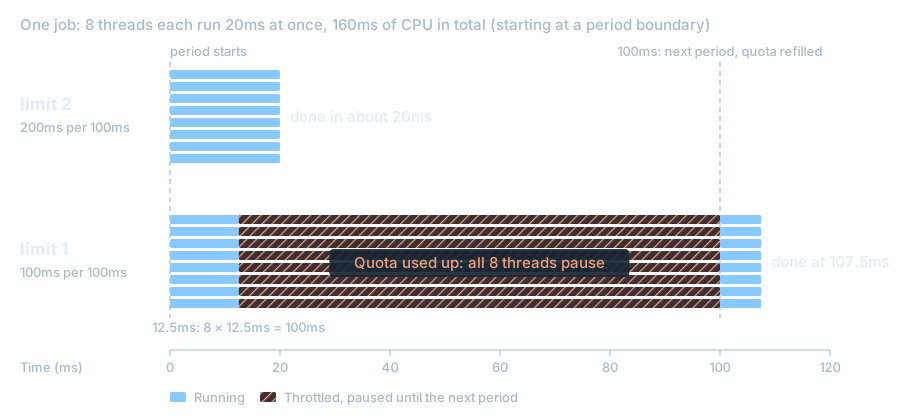
Even if this job runs only once a second and uses just 0.16 CPU on average, limit 1 still pauses it every time. In the lab, the same job finished in about 34ms with limit 2 and about 84ms with limit 1. The comparison of four limits is in the lab article.
Back to the service from the start. Each request needs about 6ms of CPU. The service gets 100 requests per second on average and handles them with up to 10 threads at once (the lab Node has 10 CPUs). The only difference is how the requests arrive:
| How requests arrive | Average usage | Throttled periods | p99 latency |
|---|---|---|---|
| One at a time | About 0.6 CPU | 0% | 13ms |
| 50 at a time | About 0.64 CPU | About 30% | 370ms |
The averages are almost the same. When requests arrive one at a time, each period needs far less than 200ms of CPU, so the budget never runs out. When 50 arrive together, the group needs 300ms of CPU. With 10 threads running at once, the 200ms budget is gone in about 20ms, and the whole service stops until the period ends. The rest of the group, and any other requests that arrive in the meantime, all have to wait for the next period.
Whether a service is throttled depends on how much work it has within 100ms, not on how much CPU it uses on average.
3. Why can't the dashboard show it?
CPU usage on a dashboard is usually the average of container_cpu_usage_seconds_total over a time window, such as 1 or 5 minutes. The service at the start gets only two groups of requests per second. Each group uses 300ms of CPU within a few tens of milliseconds, and the rest of the time is almost idle, so the average is only 0.64 CPU. A per-minute average cannot show a rush within 100ms.
What you need to look at is the throttling metrics. The kernel records how often and how long each cgroup is throttled in its cpu.stat, and cAdvisor turns these into monitoring metrics. cpu.stat fields The most direct one is the share of periods that were throttled, viewed per container:
rate(container_cpu_cfs_throttled_periods_total[5m])
  / rate(container_cpu_cfs_periods_total[5m])
For the service at the start, this ratio is about 30%. Each related number tells you some things but not others:
| Metric | What it can tell you | What it cannot tell you |
|---|---|---|
| CPU usage | How much was used on average over a period of time | Bursts within 100ms |
| Share of throttled periods | Of the busy periods, how many used up the budget | How long the pauses were. The denominator only counts periods where something ran and does not grow while idle, so 30% does not mean the service was paused 30% of the time |
container_cpu_cfs_throttled_seconds_total | Whether pauses are getting longer or shorter | The actual pause time. It adds up the pause time of every CPU, so 8 threads pausing together for 40ms count as 320ms |
These metrics answer "was it paused, and how much?" but not "were users affected?" To judge the impact, go back to latency itself. For the service at the start, the two match: with the same traffic and no limit, p99 was only 74 to 86ms.
4. Why doesn't raising only the limit always help?
Since throttling happens when the quota runs out, the most direct fix is to raise the limit. When the Node has idle CPU, this does help: with the limit raised from 2 to 4, a group's 300ms fits into one period's 400ms, and throttling almost disappears.
But a limit is only a cap, not a guarantee. Whether the service can actually use it depends on whether the Node still has idle CPU. When the Node is busy, the request decides how much each Pod gets: at run time, the request becomes the cgroup's cpu.weight. When there is not enough CPU to go around, Pods share it roughly in proportion to their weights. When there is idle CPU, weight has no effect, and anyone can use it. How requests are applied at run time
Suppose the same Node has a neighbor Pod with request 4 and no limit that keeps using all the CPU it can. After the service at the start raises its limit to 4, how much CPU it gets on a fully loaded Node depends on its request:
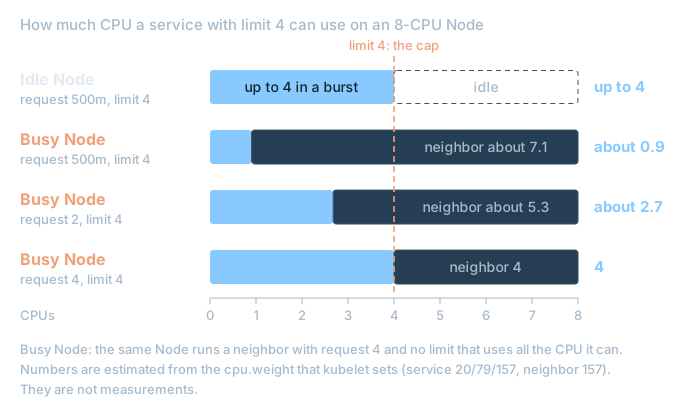
With the request left at 500m, the service gets less than 1 CPU and never gets anywhere near its limit of 4.
The lab reproduced this scenario and ran each setting twice (with the Node limited to 8 CPUs; details are in the lab article). With the same traffic, the p99 latency and the share of throttled periods were:
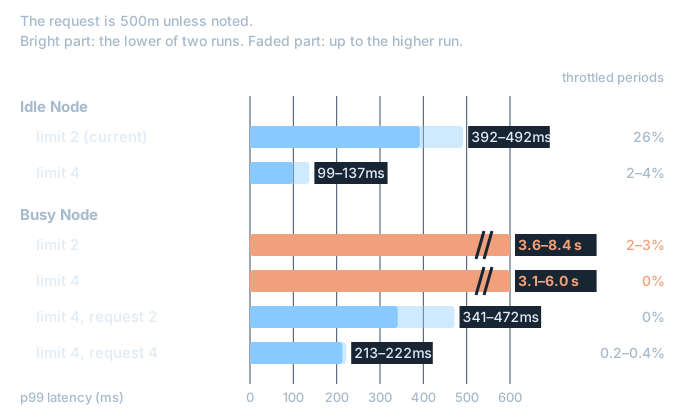
On the busy Node, limit 2 and limit 4 were equally slow, with p99 of several seconds. Yet throttling was almost 0, because the service could not even use up its quota. If you only look at the throttling metrics, you would think the problem was solved. With a higher request, the service got CPU back on the busy Node, but even with both request and limit at 4, it was still slower than on the idle Node.
So whether raising only the limit helps depends on two things: whether the new quota can hold one burst, and whether the Node has idle CPU at the moment of the burst. The first has to follow the peak: if the burst doubles, limit 4 is not enough again. The second is outside this Pod's control. To get the CPU even when the Node is busy, you have to raise the request too, and a request is capacity reserved at scheduling time. It takes up room on the Node even when the service is idle.
Seen the other way, weight is also what protects neighbors when there is no limit: when there is not enough CPU to go around, each Pod gets roughly its share in proportion to its request.
5. Back to the start: what should you do?
0.64 CPU is an average over time, but limit 2 controls 200ms in each 100ms. This service's requests arrive in groups, and each group needs 300ms of CPU, more than one period's budget can hold. 10 threads use up the 200ms within 20ms, and the rest of the group waits for the next period, along with the other requests that arrive in the meantime. A low average, a lot of throttling, and a high p99 are all true at the same time.
Section 4 showed that whether raising the limit helps depends on how big the burst is and whether the Node has idle CPU at that moment. Raising the request too gets CPU back on a busy Node, at the cost of reserving capacity for the peak all the time. So first find out what the bursts look like, then decide what to do.
Confirm first, then estimate the burst
- Confirm that latency and throttling happen together. Check the share of throttled periods and the timing of the latency, Pod by Pod. If there is throttling without latency, or latency rises without throttling, the problem is somewhere else.
- Estimate how much CPU one burst needs. Multiply the number of requests in a group by the CPU each request uses, and compare it with the quota of one period. For the service at the start, that is 50 × 6ms = 300ms, while the quota is only 200ms.
- Find where the bursts come from. Scheduled jobs or batches that fire at the same time, an upstream service that fans out many requests at once, and mass retries after a failure can all make requests arrive in groups.
Add replicas, or raise the limit?
Another common approach is to add replicas. On a Node with idle CPU, the lab compared adding replicas with raising the limit under the same traffic (this is a different run from the one at the start, so compare only the relative differences in the chart):
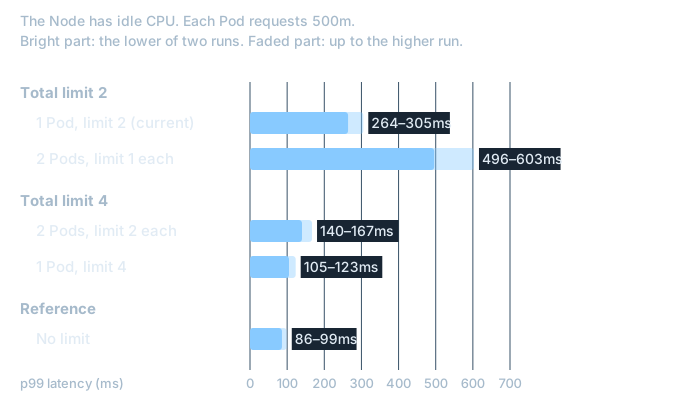
The result is not quite what you might expect. Splitting the same limit between two replicas was actually slower: each Pod got about 25 requests, or 150ms of CPU, which is still more than its own 100ms budget, and the budget one Pod does not use cannot be borrowed by the other. With the same total limit of 4, one Pod with limit 4 also did better than two replicas with limit 2: a group's 300ms fits within one period. With two replicas, it depends on how evenly the requests are split, and in the lab the two replicas did not get an even share (possible reasons are in the lab article).
Choices and their costs
- Keep the request, and raise or remove the limit. The scheduling capacity stays the same, and bursts borrow idle CPU on the Node. This works best when the Node is idle. The cost is that the Node must really have idle CPU. On a busy Node, the share is decided by the request, and the throttling metrics do not show the problem (section 4). The higher the limit, the looser the cap that stops a runaway Pod.
- Add replicas. This only helps if the total limit grows too, and it helps less when requests are not split evenly between replicas. HPA adjusts the replica count based on average usage over a period of time and cannot see bursts within 100ms. So size the replica count for the peak in advance, and do not count on autoscaling to save you.
- Raise both request and limit. The service gets CPU back even on a busy Node, but this wastes the most in normal times: a request is capacity reserved at scheduling time and takes up room on the Node even when the service is idle.
- Smooth out the traffic. Fix it at the source: add random delays to scheduled jobs, make upstream services queue or rate-limit, and add backoff to retries. This is the only approach that makes the burst itself smaller.
- Limit how much is handled at once. For example, reduce the number of threads the service uses to handle requests, or use a fixed-size worker pool. The throttling metrics drop a lot, but the work that gets done in each 100ms does not grow; "pausing" just turns into "queueing." In the lab, cutting the threads from 10 to 2 lowered the share of throttled periods from about 30% to about 4%, but p99 got higher, and unrelated small requests became more than three times slower. This approach is useful together with priorities, so important requests go first. It is not a way to lower the throttling metrics.
Whichever you choose, confirm the effect with latency, not only with the share of throttled periods.
Further reading
These topics do not change the main conclusions. Open them when you need them.
Online cases of "throttled without using it all"
Many articles about CPU throttling mention usage far below the limit together with heavy throttling. Some of these cases were actually a kernel bug in Linux 4.18 through 5.3. The kernel hands out quota to each CPU in slices (5ms by default), and starting in 4.18, unused slices on each CPU expired. Programs with many threads that each used little CPU were therefore throttled before they had used up their quota. The problem was fixed by commit de53fd7aedb1 and merged into Linux 5.4. The fix When you read the numbers in these articles, first check the kernel version they used. The change that caused the problem was also backported to older kernels, so check what your distribution actually ships.
What remains after the bug fix is the mechanism described in this article. There are only a few settings that change it, and this article did not test any of them:
| Setting | What it does | Status |
|---|---|---|
kernel cpu.max.burst (5.14 and later) | Lets unused quota build up, so a burst can use a bit more | Kubernetes has no way to set it; the related issue has been open since 2021 |
kubelet cpuCFSQuota: false | The whole Node stops enforcing CPU limits | Affects every Pod on that Node |
kubelet cpuCFSQuotaPeriod | Changes the period length | Needs the CustomCPUCFSQuotaPeriod feature gate, which is still Alpha |
CPU Manager static policy | Guaranteed containers with an integer CPU request get exclusive CPU cores and no quota | DisableCPUQuotaWithExclusiveCPUs has been Beta and on by default since 1.33; the conditions are in the kubelet code that sets CPU resources |
Two details of the throttling metrics
A container's cpu.stat only records pauses caused by that container's own limit. If the pause comes from a level above, such as the Pod-level cap, it is recorded in that parent cgroup. On Linux 6.6 and later, cpu.stat.local in the same directory shows the pauses the container actually experienced. The Pod-level cap is the sum of the limits of its containers; if any container has no limit, the Pod level has no cap.
Also, cAdvisor collects values periodically, and each sample comes with the time it was collected. If you compute a rate yourself from two scrapes, divide by the difference between the sample timestamps, not by the time between the two scrapes. The lab article has a real example.
How many CPUs the application sees
The more threads there are, the faster the budget runs out, and many runtimes choose their thread count based on how many CPUs they "see." That number does not always follow the limit, and it changes between versions. The lab service is written in Go. Go changed this default in 1.25, and the behavior depends on the version line in go.mod. These details, and the JVM case, are in section 4 of the lab article. Before changing anything, check how many threads the service actually uses.
The Kubernetes implementation in this article was checked against v1.34.0, and the kubelet weight conversion was compared with v1.35.0–v1.37.0 and has not changed. The lab ran in throwaway kind clusters on OrbStack on the author's Mac (Kubernetes v1.34.11, 10 CPUs, kernel 7.0), so read the latency only as an order of magnitude. A kind Node is itself a container, so the top levels of its cgroup tree differ from a real host. Requests arriving in groups is a traffic shape made on purpose to reproduce the state at the start. The neighbor that keeps the Node full in section 4 is also an extreme case made on purpose.